Network Density Analysis
Our post-GWAS analysis method (network density analysis; NDA) reveals new biological features of numerous disease states and traits. It works by examining a coexpression network of transcription start sites (discovered in FANTOM5). We find that transcripts containing GWAS hits for a given trait tend to fall into more dense groupings in the coexpression network than randomly-selected transcripts.
NDA demonstrates that GWAS hits for a given disease tend to be near promoter/enhancer elements with similar expression profiles, which enables us to find more hits, fine map probable causative SNPs, and implicate cell types in pathogenesis. Surprisingly, for some diseases, the underlying variants fall into distinct functional groups, suggesting either dual mechanisms of disease, or distinct disease endotypes.
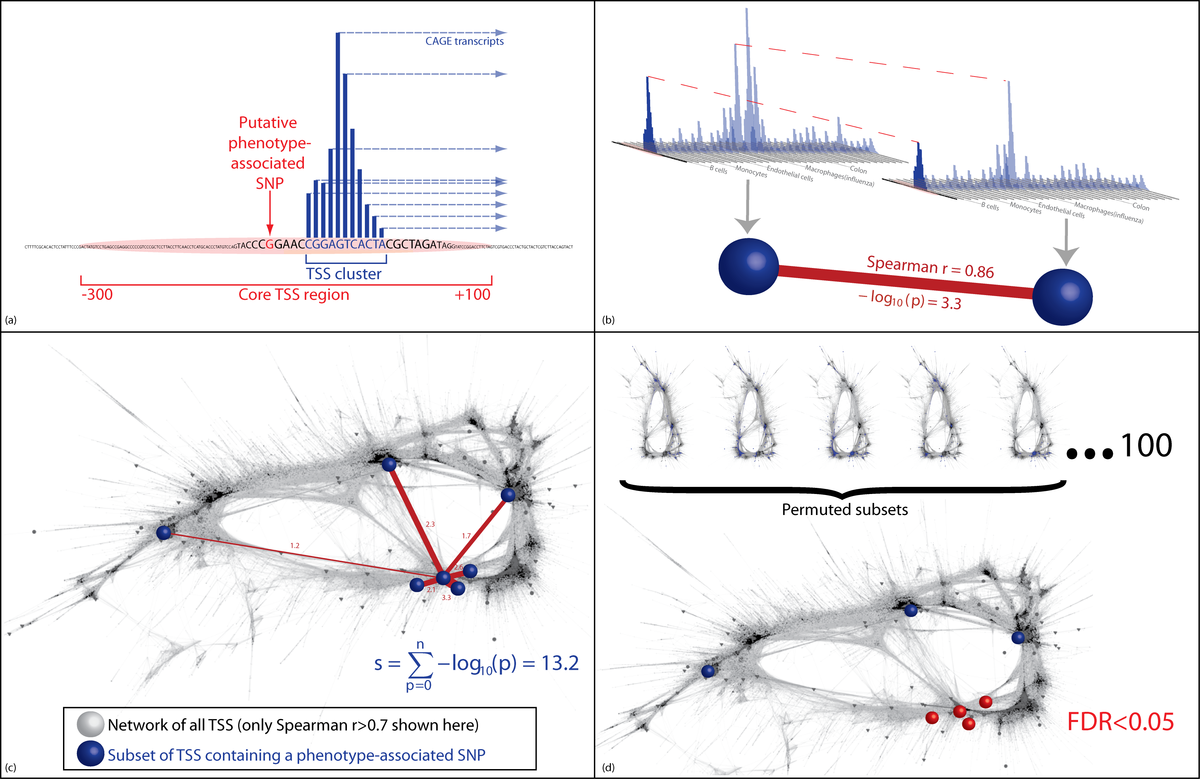 Network density analysis method for detecting significant coexpression among GWAS hits. (a) A subset of regulatory elements is identified containing disease-associated SNPs. (b) The strength of the links between pairs of these regulatory regions is quantified, first as the Spearman correlation, then as the -log10p-value quantifying the probability, specific to this regulatory region, of a Spearman correlation of at least this strength arising by chance. This is determined from the empirical distribution of correlations between this regulatory region and all other regulatory regions in the entire network of all regulatory regions in the genome. (c) The subset of regulatory regions containing disease-associated SNPs form an unexpectedly dense grouping in the network. The NDA score assigned to any one node is the sum of the links it shares with other nodes in the chosen subset. d) NDA scores from the input subset of regulatory elements are compared with NDA scores from permuted subsets of regulatory elements in order to quantify the false discovery rate (FDR).